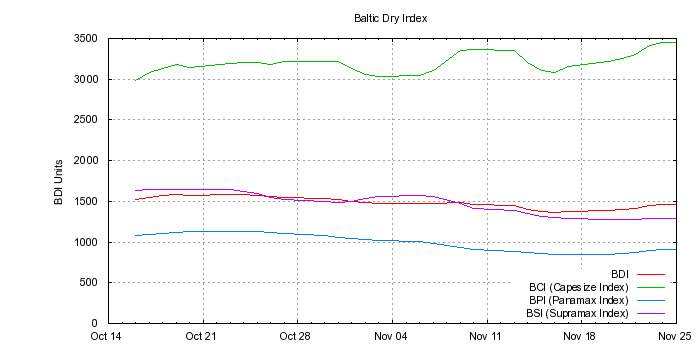
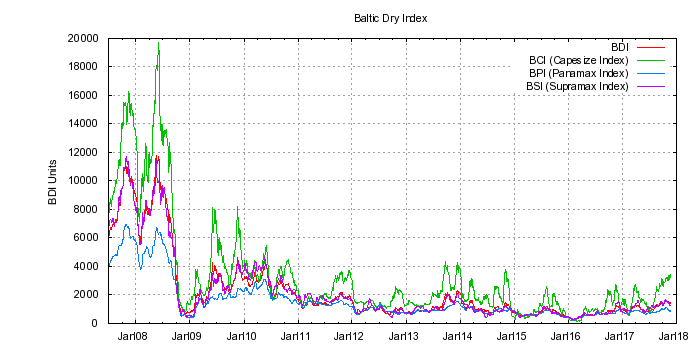
Baltic Dry Indices
The BDI is a weighted blend of the BCI (Capesize ships - around 150,000 tons),
the BPI (Panamax - around 80,000 tons), and the BSI (Supramax - around 50,000 tons).
Click the graph to see only the last 6 weeks.
(Note: PNG images fail to render properly on Firefox 11.0 works fine in Firefox 10.0, IE, Chrome, Opera)
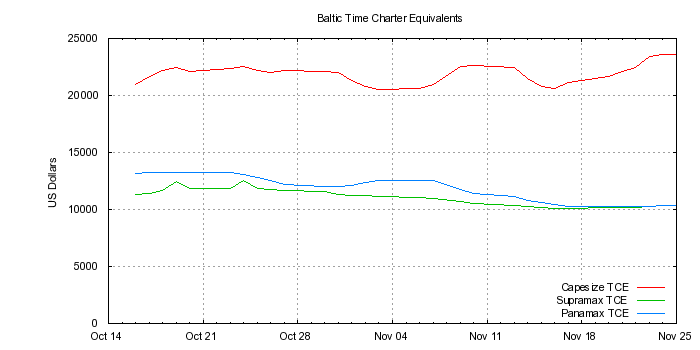
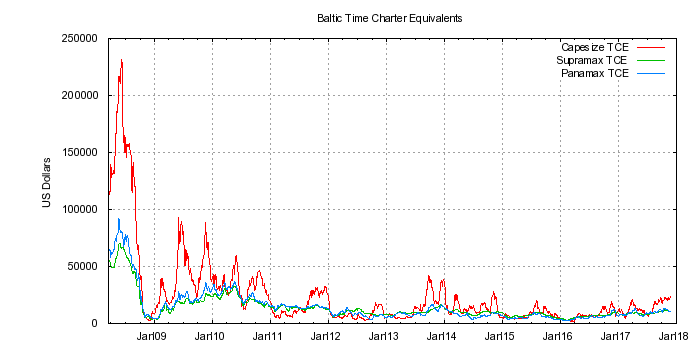
Time Charter Equivalent
The TCE rate (time-charter equivalent per ship per day) is defined as the
voyage and time charter revenues less voyage expenses during a period
divided by the number of operating days during the period.
The TCE rate is a shipping industry performance measure used primarily
to compare daily earnings generated by vessels on "time charters"
with daily earnings generated by vessels on "voyage charters".
Vessels on "time charters" generally are expressed as a daily rate whereas
charter hire rates for "voyage charters" are reported for the entire trip.
Handymax ships (around 30,000 tons) are no longer tracked by the BDI but should
typically get 1/2 to 2/3 of the TCE of a Supramax ship. Sooty mentions this because
he owns shares in FreeSeas (Nasdaq:FREE). This small company runs nine Handymax ships
and pays a healthy dividend (well it used to). It has a good Current Ratio, a better than
average Debt/Equity ratio, and should be a good long term hold.
You can use the TCE to evaluate performance. In April 2009 FREE was getting an average
of $19,000 per day on its ships. This is excellent considering the Supramax TCE was only
$12,000 at that time (so a Handymax estimate would be $6,000 to $9,000). Outperforming
the average TCE should equate to outperforming dividends in the future. The BDI is extremely
volitile and difficult to predict but it is generally agreed the April 2009 value is very
depressed and should be double or triple by the time the world recovers in Fall 2009. Since
most of the FREE costs are either fixed or dependant on the interest rate an increase in
the BDI should substantially increase their cash position and dividends.
Click the graph to see only the last 6 weeks.
(Note: PNG images fail to render properly on Firefox 11.0 works fine in Firefox 10.0, IE, Chrome, Opera)
This data is updated every morning at 8:00 AM Pacific Time.